

Welcome!
Construction Science, LLC has established a new website (www.primaverascheduling.com) to handle registration for all of our in-person and online Primavera P6 training programs. Our corporate website (www.constructionscience.com) will begin directing visitors to the new website for registration starting on March 15, 2013. In the meantime, visitors can continue to register for P6 classes on both websites. We will continue to utilize the corporate website for other services that we provide such as Primavera scheduling, change order and claims preparation, and dispute resolution.
We welcome your feedback regarding our new website. Please use the Contact Us page to submit feedback. Thank you!
Bill Pepoon
Discounted Training for March 2013
To celebrate completion of our new website (www.primaverascheduling.com) we are offering a 10% discount on any of our online or in-person P6 training programs. Just enter the discount code “MAR13” during checkout. Training must be booked no later than March 31, 2013 to get this discount. Hope to see you soon!
Have You Visited our YouTube Channel?
Our YouTube channel contains several short videos explaining some of the features of Primavera P6 such as creating portfolios, lookahead filters and baselines. These videos were recorded using the same GoToMeeting software that we use in our live online training programs. However, we do not use any videos in our online training. These classes are always live! The YouTube videos are intended to provide snippets of our training programs only.
Here is the link to our YouTube channel: http://www.youtube.com/channel/UCjqAoV6JaNCh7ld2mIvgfdQ?feature=mhee
Nevertheless, we are exploring the option of offering our 4-hour Primavera P6 Quick Start training program in a video format. This would be a series of roughly 15 video lessons that would cover the same subject matter as our live Quick Start P6 program, with the option to call us with any questions up to 30 days later.
My feeling is that our Primavera P6 Quick Start program is an introduction to P6 that would translate well to video lessons. And by making it available on video, clients could access the lessons online whenever they want. I really enjoy teaching the online classes because it is a great opportunity to meet people. Still, the videos would be very convenient.
We are exploring a couple of pricing models for the Primavera P6 Quick Start video program:
- $200 for access to the online videos, but no live follow-up support
- $300 for access to the online videos, with 30 days of live support
Our live Primavera P6 Quick Start program is $300, by the way. There will most likely be a limit to accessing the videos online to ensure than the videos are not being watched by people who did not purchase the program. For example, we might have a “time bank” whereby each lesson can only be viewed twice.
So, what do you think? I’d love to hear your thoughts!
“Going to Kansas City”
I am excited to be heading back to Kansas City to lead another Primavera P6 102 training program. I will be training members of the telecommunications group at Black & Veatch, one of the largest engineering firms in the world with over 9,000 employees. This is my second training program for Black & Veatch. I trained a large contingent at the telecommunications group two years ago. This makes my father very happy, as he started his professional career working for Black & Veatch. Back then Black & Veatch had perhaps a few hundred employees. My father still remembers going out on surveying assignments with Mr. Veatch. Ironically, my dad left Black & Veatch because he did not think there would be much room for advancement! After a short stint working for a general contractor in Paola, Kansas, he started his own construction company with two partners and ran this company quite successfully for more than 25 years. Hard to believe, but my dad has been retired for nearly that long as well. He turns 85 in May 2013.
Update: please note that our Primavera P6 101 class in Kansas City on April 16th is now full. We will be back in Kansas City later this year. Please contact us to be added to our mailing list for the next training session. Thank you.
53,000 new construction jobs added in California
California tends to have the reputation of being Ground Zero for all sorts of problems, but there have been a lot of positive signs in the past couple of years. Exports are at an all-time high, for example. Many people do not realize that we are the biggest producer of rice in the United States, and perhaps you have heard of our wine industry? There is almost nothing that grows in the United States that is not grown in California.
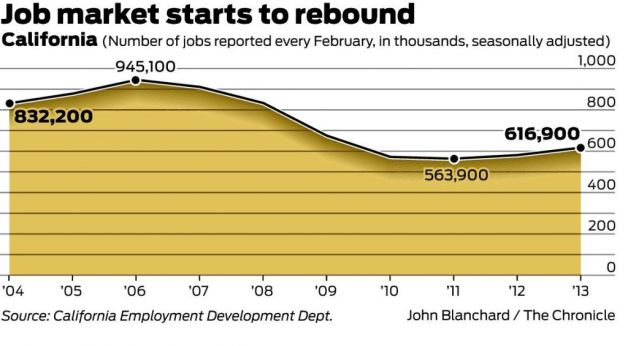
This rebound is starting to include construction. The state Employment Development Department reports that 53,000 construction jobs have been added in California during the past two years. While the number of construction jobs is well below the peak of 2006 (as seen in the graphic below produced by the San Francisco Chronicle) the housing bubble was still in effect back then. Construction employment will not reach those levels again for quite some time, if ever.
Nevertheless, California is embarking on a +$100B high-speed rail project this summer, and if Gov. Jerry Brown has his way, a $11B water diversion project in the delta area may start in 2014. Construction employment numbers should continue to improve for the next several years for these reasons alone.
Apple’s “Spaceship” $2 Billion Over Budget?
Bloomberg BusinessWeek reported on April 4th that cost estimates for Apple’s new futuristic headquarters in Cupertino, CA have ballooned from $3 Billion to $5 Billion since plans were first revealed by the late Steve Jobs in 2011.
Officially designated as Apple Campus 2, construction was supposed to have started in 2012. Apple submitted revised construction drawings to the City of Cupertino in November of 2012. Review of the new drawings was expected to take several months. This image, posted on the city’s website, is simply breathtaking!

Apple has never released any budget estimates to the public and Businessweek offers few clues as to why cost estimates would have skyrocketed. The footprint of the project has increased from 50 acres to 175 acres, but this has been known since 2006. However, there are a few major projects in the Bay Area currently competing for resources: both Facebook and Google are building new headquarters and construction of a new stadium for the San Francisco 49ers in Santa Clara is just now winding down.
Ironically, for a company headquartered on One Infinite Loop, Apple may be learning firsthand that resources for construction projects are rather finite. Right now in San Francisco, Local 6 of the International Brotherhood of Electrical Workers (IBEW) is reporting 100% employment. Projects in San Francisco are importing electricians from other cities. As noted in my previous post, construction employment has increased in California the past two years – especially in the Bay Area.
The good news? Apple is committed to using Primavera P6 on the Apple Campus 2 project. All contractors are required to utilize this software. As Primavera schedulers we are happy to see P6 being used for such a high-profile project.
Primavera P6 Professional Version 8.3 Released
Oracle recently released Version 8.3 for both P6 Professional (PPM) and P6 Enterprise (EPPM). Today we will be discussing changes to P6 Professional.
Visualizer
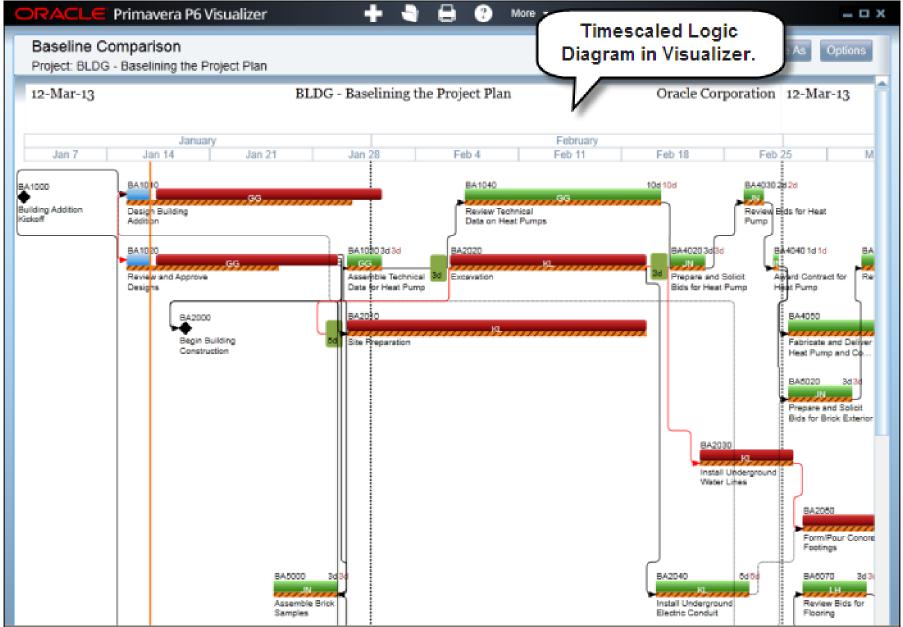
Visualizer is a new feature that supports graphical reporting via customizable Gantt charts and timescaled logic diagrams (TSLDs). The TSLD was initially introduced with Version 8.0 and is now replaced by Visualizer. One of the advantages of a TSLD is the ability to show more than one activity on the same line, which reduces the height of the logic diagram considerably.
In addition to the P6 Professional’s standard graphical features, Visualizer adds the following features:
- Stack columns and use word wrapping in the Gantt chart
- Use notebook topics or a list of steps as a bar label or as a field in the activity table
- Apply various fonts to individual labels and fields
- Color-code and apply different shapes for bars and endpoints
- Draw bars on top of each other, for example, to show critical highlighting
Visualizer is a desktop application that can be launched either from within P6 Professional or from the computer’s start menu. It connects directly to the P6 database. This marks the first time users have been able to view project data without launching P6.
After launching Visualizer, users can choose to create or open a TSLD or Gantt chart. Users can also print and manage layouts from inside Visualizer. P6 Professional layouts or Visualizer layouts created by other users can even be imported.
The Gantt chart includes a grid and a bar chart. The grid displays activity information in a table format, similar to the Activity Table in P6 Professional. On the Chart & Grid tab in Layout Options, display the Gantt chart, the grid, or both.
The screen below shows an example of a TSLD in Visualizer with multiple bars per row and critical activities coded in red:
Discussion Feature
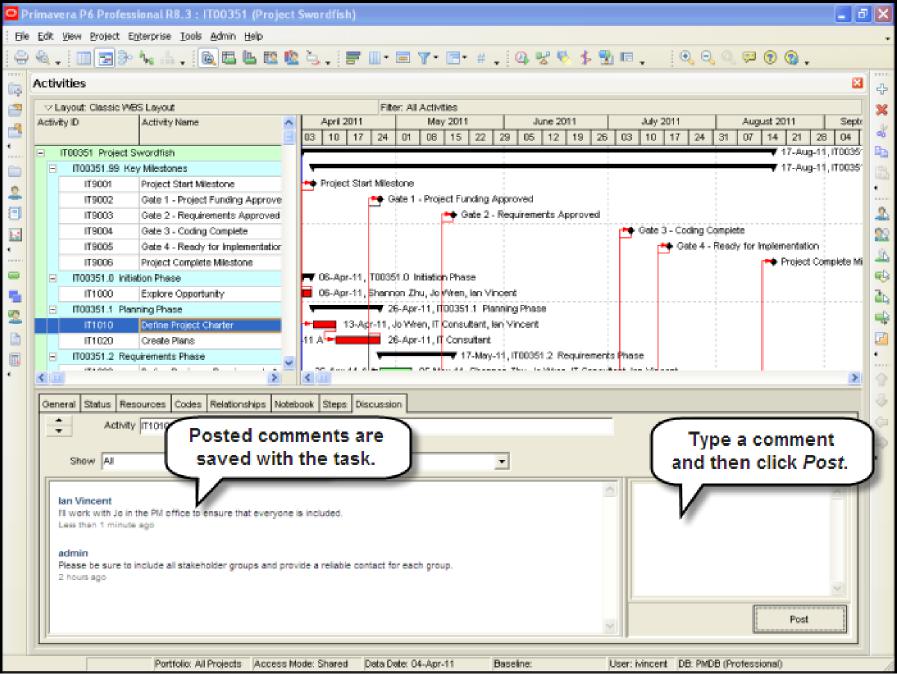
Previously we had the ability to track comments about activities using the Notebook tab in the Activity view. Version 8.3 adds a new Discussion feature that tracks these comments by team member. All comments are dated and labeled with the contributor’s name. Similar to Notebook comments, Discussions are stored electronically with the activities. This is a nice tool for encouraging dialogue and feedback on activities.
Also, we can now add a column called “Unread Comments” to the Activity Table to prompt team members to review the most recent Discussions. Notebook comments, by comparison, can only be shown as a label on an activity bar and do not appear in the Activity Table.
XML Import/Export Enhancements
P6 Professional Version 8.3 provides a number of enhancements to its XML import/export functionality. Users can now exchange XML project files with previous versions of P6 Professional from Version 6.2 Service Pack 4 (SP4) onward. Also, all features supported by the P6 Professional XER format (constraining of external relationships during import, inclusion of Price/Unit in resource assignments, etc.) are supported in XML format as well.
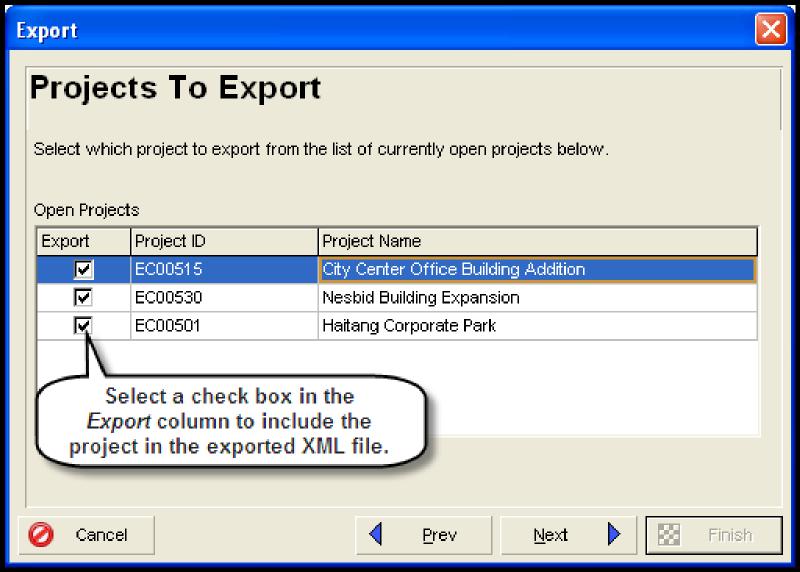
P6 Professional Version 8.3 also gives users the ability to import or export multiple projects simultaneously. When exporting multiple projects, the projects are combined into a single XML file. Importing multiple projects requires the projects to be contained in a single XML file.
Bottom Line – Worth an Upgrade?
Users who have a current support agreement with Oracle can upgrade to Version 8.3 for free. Otherwise, you will have to pay full price to get the newest version. Version 8.3 does have some nice enhancements but they are not worth buying a new license. The TSLD still does not show relationship lags – only the relationship types – despite several upgrades since it was first introduced. Users have been asking for this feature for quite a while. Of course, the Gantt chart does not show the lags either so we will have to wait until, perhaps, Version 8.4 is released.
In the meantime, we will be testing Version 8.3 for bugs. Versions 8.1 and 8.2 tend to crash more often than Version 7.0 (our favorite) so reliability is always a concern. The casual user of P6 would not miss the enhancements found in Versions 8.1 and 8.2 so it once again comes down to whether a free upgrade is available. Certainly, new users should consider Version 8.3 as there is no discount for buying older versions and Version 8.3 is backwards compatible with earlier versions of P6 Professional.
Dr. Copper Points to a Slowing Economy
Copper prices have fallen 21% since reaching a high of $3.9785 per pound in February 2012. Copper has been called the commodity “with a doctorate in economics” because its price tends to reflect the health of global manufacturing. Prices have fallen 13% this year alone. China is the top consumer of copper in the world, accounting for 40% of global demand. A slight contraction in China’s economy since the last quarter of 2012 is obviously a concern to traders. Supplies of copper stored in warehouses overseen by the London Metal Exchange (LME) are up 92% this year as a result of production by new and expanded mines. However, mines are not expected to delay new projects or shut down production unless prices approach $2.80 per pound, according to one industry expert. With prices settling at $3.1515 per pound last week, there is still a lot of room for prices to fall. The old stock market adage about not trying to catch a falling knife comes to mind right now.
Every Schedule Needs a “Hammock”
Granted, we do not call them Hammocks any longer because P6 introduced a new label: Level of Effort. This is of course an activity type. Why Oracle decided Level of Effort is a better description is rather baffling. During our training classes when we talk about Hammocks most people get the analogy of something that spans from one place to another, just like the hammocks you might see in a backyard. Simply put, a Level of Effort activity measures the distance between a predecessor and a successor. Why is that important?
We typically use a Level of Effort activity to measure the project duration. This is the only accurate means of measuring the project duration if more than one calendar is being used. We assign the Level of Effort activity a calendar that matches the calendar used to specify the project duration. So if the project is supposed to finish within 300 calendar days, we give the Level of Effort activity a 7-day calendar with no holidays.
Another excellent use of this type of Level of Effort activity is to represent overhead and profit on a cost-loaded schedule. Since the Level of Effort activity already mimics the project duration, it gives us a per diem distribution of overhead and profit for the life of the project. This is much easier than trying to add overhead and profit to each activity in the schedule.
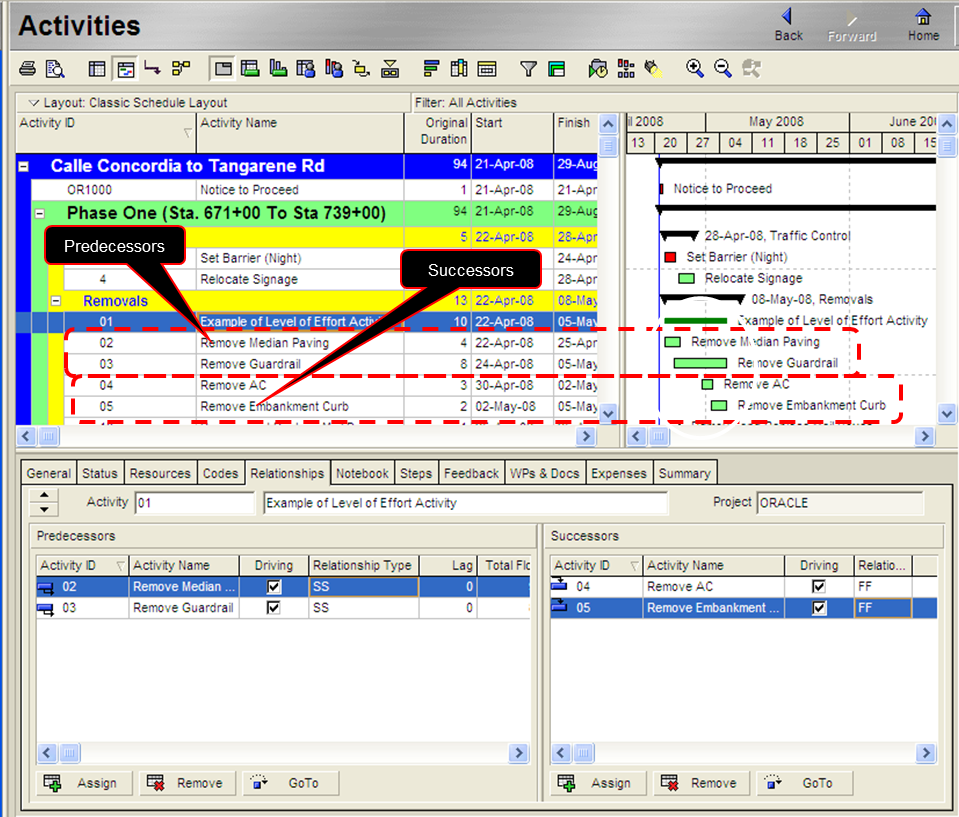
In the example below, Activity ID 01 is a Level of Effort activity with two predecessors, and two successors. When there is more than one predecessor, the earliest Start date becomes the Start date of the Level of Effort activity and the latest Finish date becomes the Finish date of the Level of Effort activity. For this to work right, the predecessor relationships must be Start to Start and the successor relationships must be Finish to Finish.
Any activities can be linked with a Level of Effort activity, so this is not always about “effort”. We could link the Start date of the first piping task to the Finish date of the last piping task and this would give us the overall duration of piping work. But if we tie the Level of Effort activity to something other than the first and last piping tasks we are not describing the overall timeframe for piping correctly. A WBS Summary activity is another option (which we will discuss later) if the only goal is to show a summary bar. Keep in mind, the duration of a WBS Summary activity may be incorrect unless all the activities it summarizes share the same calendar.
The Wrong Way to Sample Materials
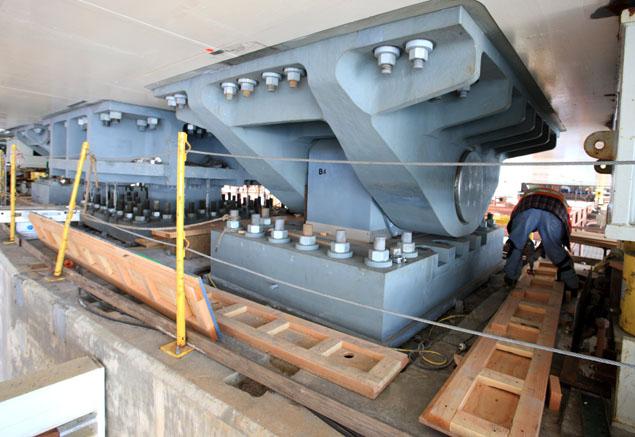 Northern California residents are well aware of the latest glitch regarding the new east span of the San Francisco-Oakland Bay Bridge. The project was already years behind schedule and billions of dollars over budget (the latter can be blamed partially on former Governor Schwarzenegger, who ordered a major redesign to incorporate a signature design element) when bolts began snapping in March 2013 during final stressing. There is concern that hydrogen contamination during or after manufacturing might have made the bolts – some of which are roughly 30 feet long – brittle. Some critics believe that Caltrans specified the surfaces of the bolts to be too hard, which in term makes them more susceptible to breaking.
Remarkably, bolts failed back in 2008 as samples were being tested but Caltrans averaged the results. If one sample failed, it was deemed okay as long as another bolt exceeded the specifications for the elongation tests. Which means that essentially 50% of all samples might have failed the tests. UC Berkeley engineering professor Thomas Devine has criticized this method of sampling, as right he should have. Anyone familiar with Six Sigma quality control (my wife and business partner Francesca is a certified Black Belt) would find it ludicrous to allow so many failures – especially on a bridge designed to last 150 years in a seismically active area. Caltrans is now scrambling to engineer a fix for the broken bolts, a task complicated by the fact that the existing bolts are in a confined space and cannot be removed.
Caltrans is unsure whether this issue will delay the planned opening of the bridge on Labor Day weekend of this year. Other bolts manufactured in 2010 have so far held up during tensioning and a decision must be made as to whether to preemptively replace these bolts. As a California resident it will be difficult to “celebrate” this bridge opening. More likely it will seem like a relief that the worst is (hopefully) over.
Recent Comments